

On 8 October 2026, WWF and the Zoological Society of London published the Living Planet Report 2026. Its headline figure is a seventy-three percent decline in the average size of monitored wildlife populations between 1970 and 2022, drawn from thirty-five thousand eight hundred and three population trends of five thousand seven hundred and ninety vertebrate species. It is the same figure as two years ago, and it will be read the same way: as a statement that three quarters of the world's wildlife has gone. That is not what it says.
What it does say is stark enough. By realm, the index records an average decline of eighty-five percent in freshwater populations, sixty-nine percent on land and fifty-nine percent at sea. The threat reported most often for the monitored populations is the loss and degradation of habitat, followed by overexploitation, climate change, pollution, invasive species and disease. The index covers mammals, birds, reptiles, amphibians and fish; it does not yet include invertebrates or plants.
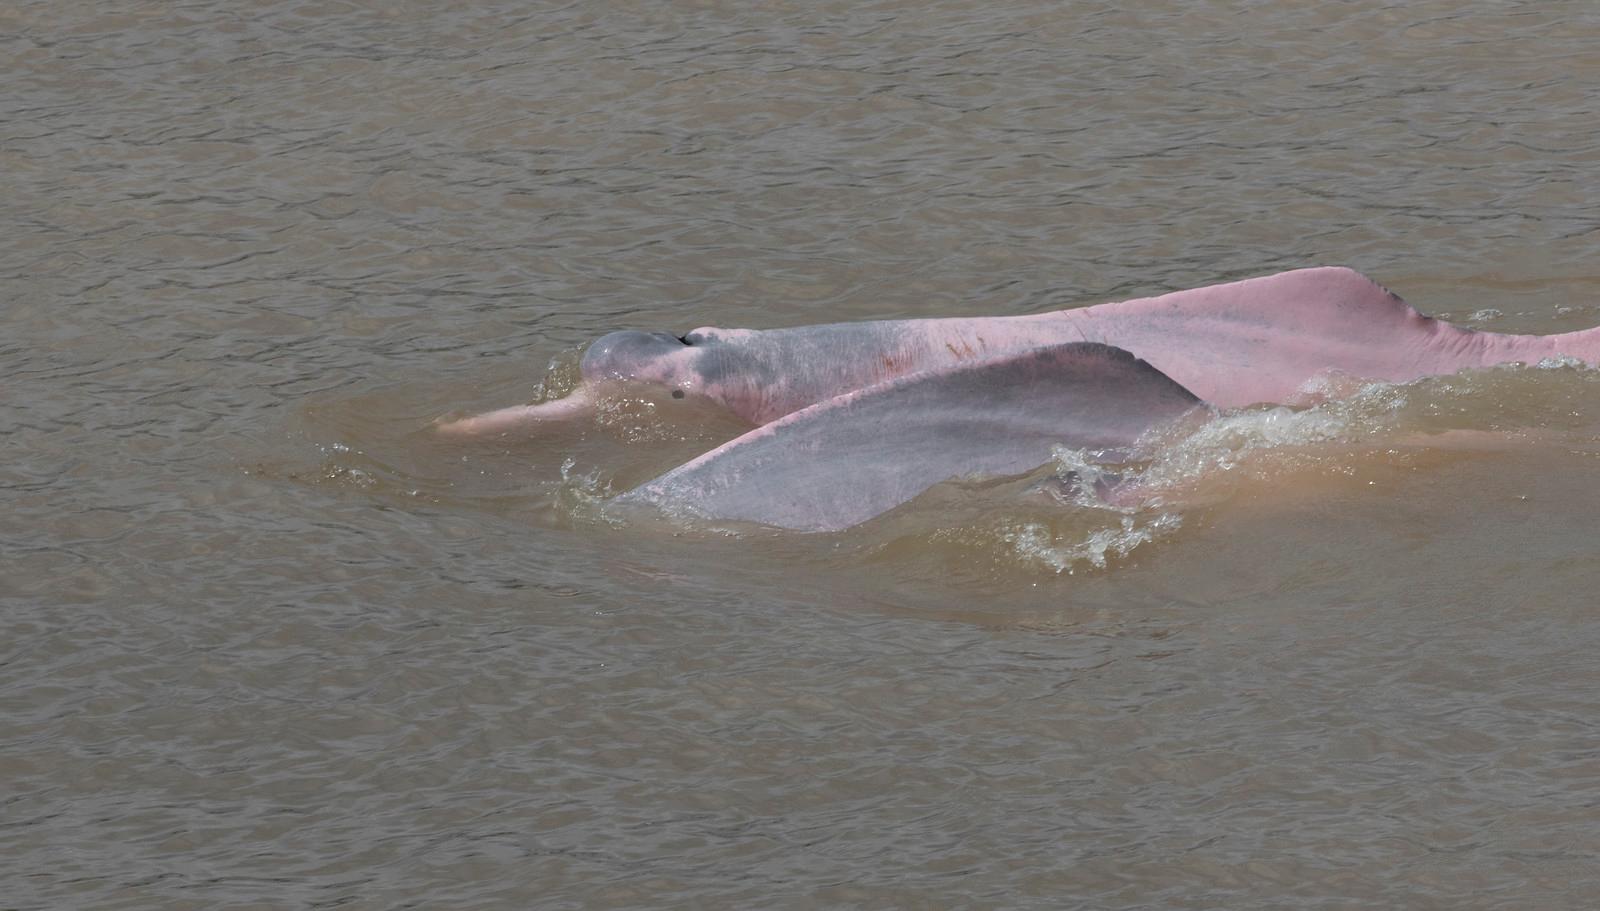
The number is an average of rates, not a count of animals. For each population, researchers calculate how its size has changed over the years for which data exist, and the index is a weighted geometric mean of those rates of change. It does not measure how many individuals have been lost, nor what share of species or populations is declining. In the present dataset, half of the monitored populations are in decline, forty-three percent are increasing and seven percent are stable. Nor does a comparison between editions measure recent change. The 2022 report gave sixty-nine percent and the two since have given seventy-three, but the whole trend line shifts as data are added: about a thousand populations have entered the index since the last edition, many of them from Africa, a region its compilers describe as previously under-represented.
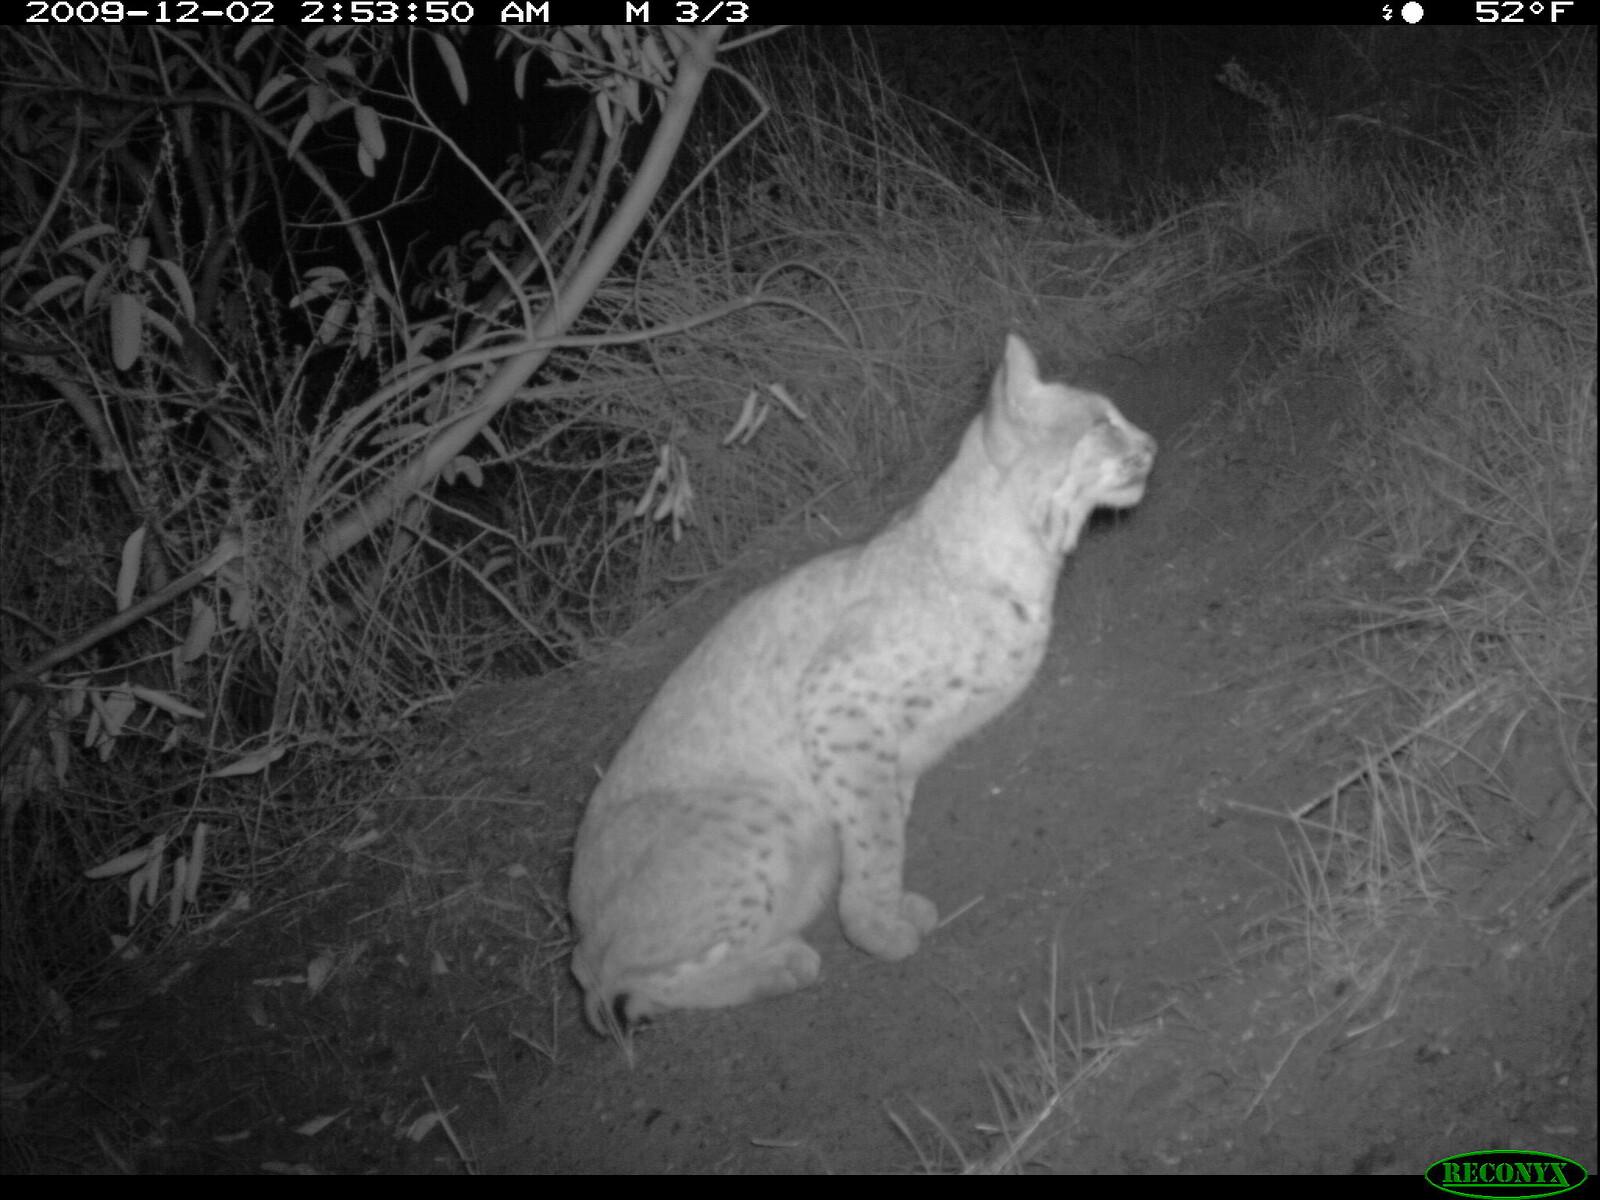
How much an average can conceal was shown in Nature in 2020. Analysing an earlier edition of the index, Leung and colleagues found that its global decline was driven by fewer than three percent of the populations; with those excluded, the mean trend turned into an increase. Clusters of extreme decline made up around one percent of populations and occurred disproportionately among larger animals, while ninety-eight point six percent of populations showed no mean global trend. The paper was contested: in 2022 the same journal published a response from other researchers under the title Do not downplay biodiversity loss. The dispute concerns how such data should be summarised. It does not concern whether populations are being lost.
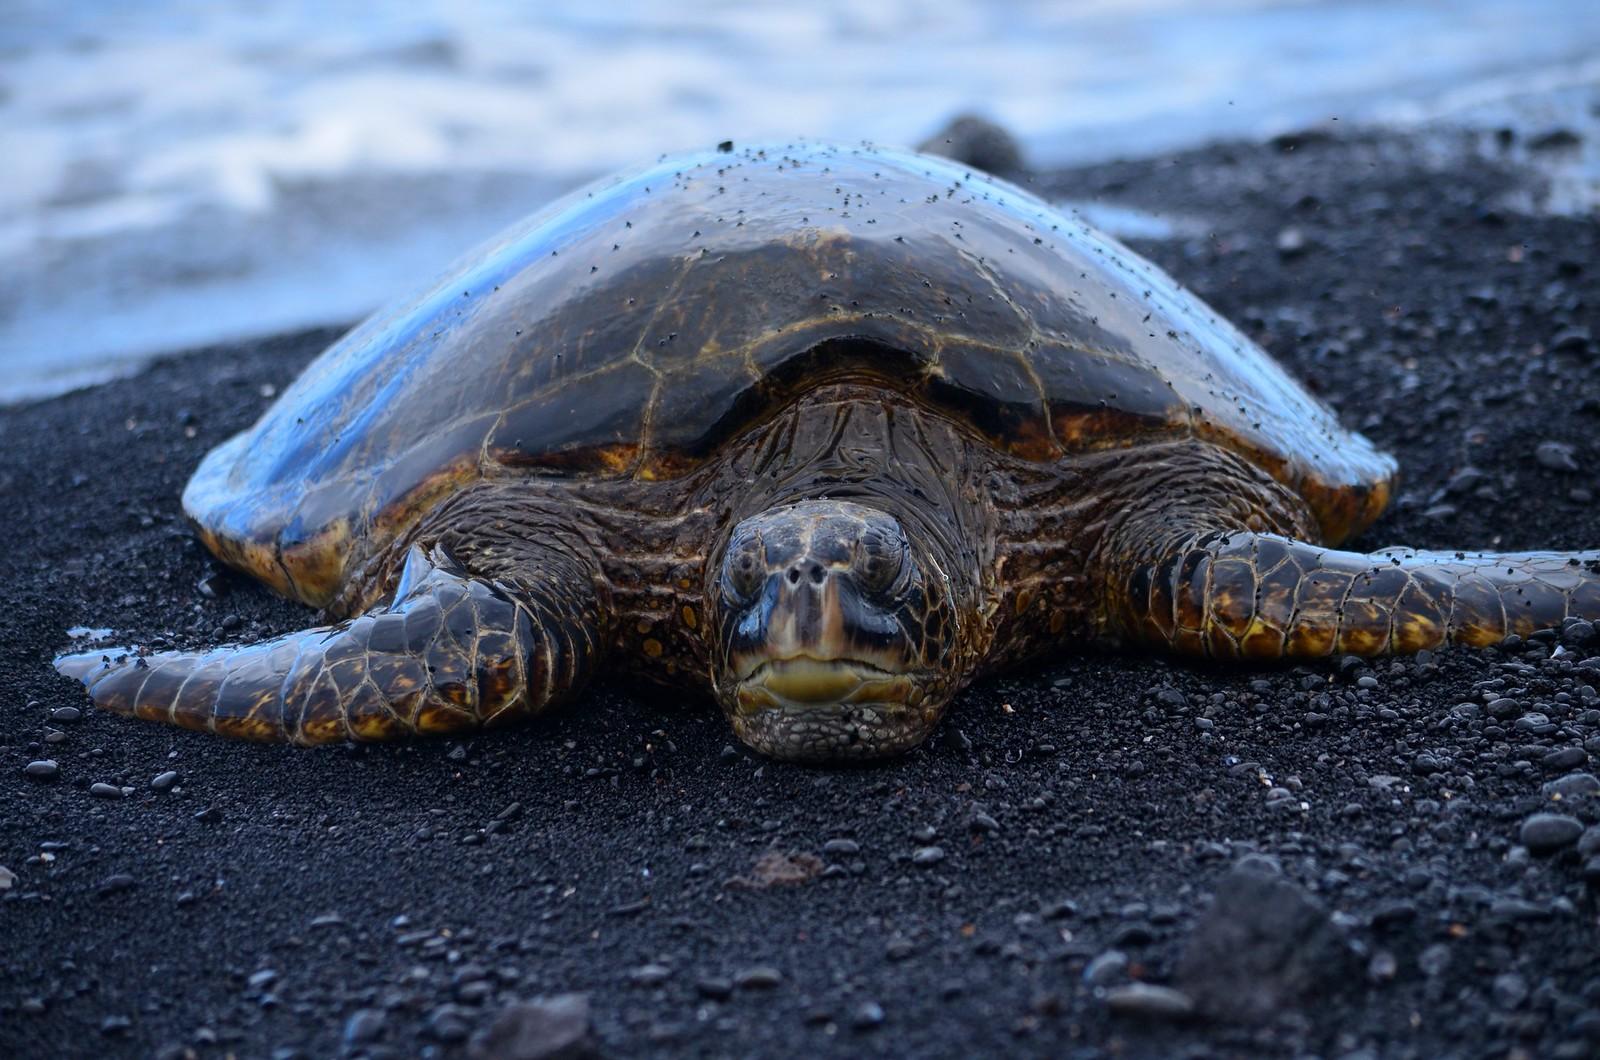
The report's own evidence points the same way from the other side. It highlights recoveries in green turtles, bluefin tuna, tigers and southern African elephants as proof that targeted conservation delivers results, and adds in the same breath that the declines cannot be reversed by conservation efforts alone. Recoveries, like collapses, happen to particular populations in particular places.
It is worth stating precisely what this evidence supports and what it does not. The index describes monitored vertebrate populations, which are not a random sample of life on Earth, and its coverage is uneven. WWF is a conservation organisation with a campaigning purpose, although the index itself is compiled by the Zoological Society of London and its method is published. The share of populations that are stable or increasing says nothing about how many animals they contain. And nothing in the index establishes what is happening in any given forest: it is a summary, and a summary cannot be applied to a hectare.
And there the reading reorders itself. An average is not a place. The seventy-three percent belongs to no river, forest or reef; it is the arithmetic of thirty-five thousand local histories, half of them histories of decline and nearly half of them not. What most often separates one kind from the other, according to the index's own list of threats, is what has happened to the land and water beneath them. Wildlife is not lost in general. It is lost, most often, where habitat has been cleared or degraded, and the first condition for holding is that it has not been. The state of the ground is the variable the headline number does not show.
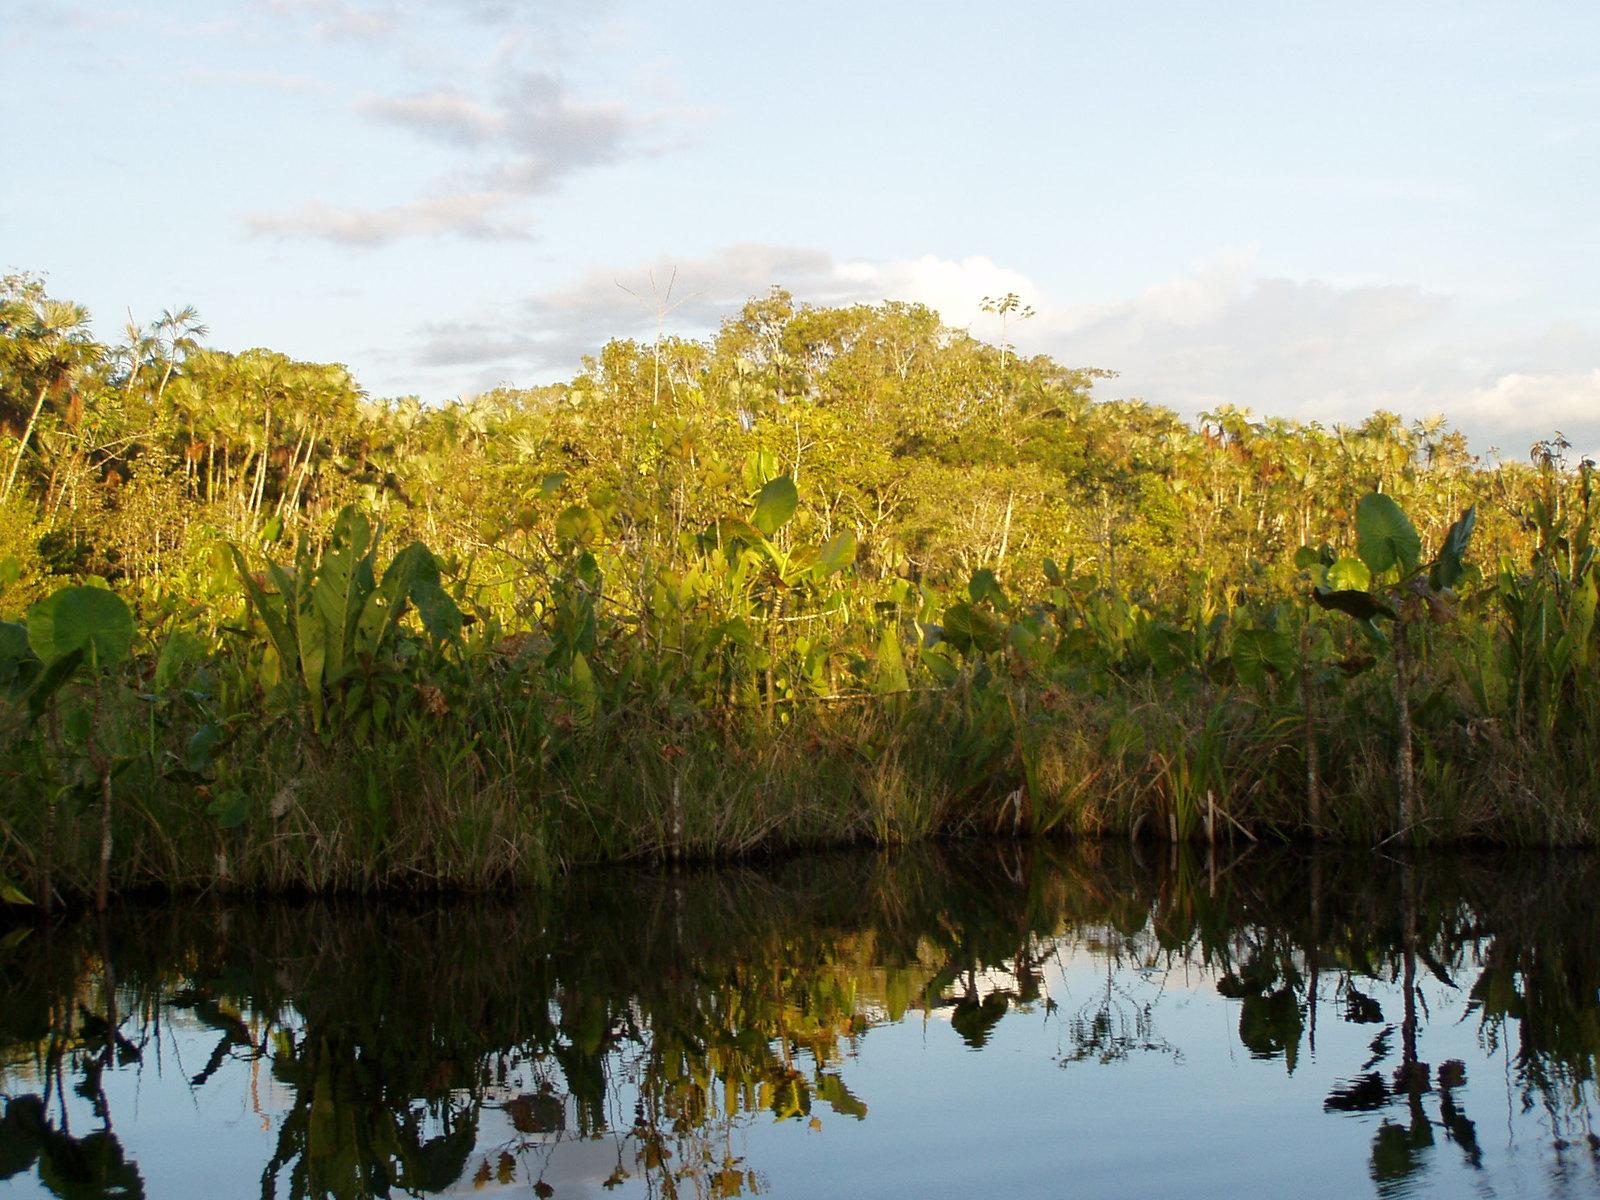
That is the premise behind Hortus Deliciarum in the Ecuadorian Amazon: securing primary forest under title and long-term custody is not philanthropy. It is holding habitat in the condition the index names first, before the decline rather than after it. If the most frequently reported cause of loss is the loss of habitat, what is the hectare worth where the habitat has never been lost? The documentation is at www.hortusdeliciarum.org
SOURCES
Institutional monitoring — WWF, Living Planet Report 2026: The Science of Hope, Gland, 8 October 2026; Marconi, V. et al., A deep dive into the Living Planet Index 2026: a technical report, Zoological Society of London; WWF press release. Peer-reviewed research — Leung, B. et al., "Clustered versus catastrophic global vertebrate declines", Nature 588, 267–271 (2020), doi 10.1038/s41586-020-2920-6; Loreau, M. et al., "Do not downplay biodiversity loss", Nature 601, E27–E28 (2022), doi 10.1038/s41586-021-04179-7. Data analysis — Ritchie, H., "A 73% average decline in wildlife populations: an overview of the 2026 Living Planet Index report", Our World in Data, 8 October 2026. Methodological note — The report's figures were taken from the WWF press release and from Our World in Data's analysis of the technical report; the report and the technical report themselves were not opened. The breakdown of populations into declining, increasing and stable is from Our World in Data. Loreau et al. was consulted by its bibliographic record only, and its argument is not summarised here beyond its title. Photo credits — Cover, tiger: Paul Mannix, CC BY 2.0. River dolphin: Gregory 'Slobirdr' Smith, CC BY-SA 2.0. Camera-trap image: U.S. National Park Service, public domain. Green turtle: sonstroem, CC BY 2.0. Forest in Yasuní: twiga_swala, CC BY-SA 2.0. All via Flickr.
© Hortus Deliciarum Strategic Conservation | Amazon
This document is provided for informational purposes. Data and findings are sourced from peer-reviewed research, government records, and verified scientific publications.